Continuous Delivery and DevOps are well known and widely spread practices nowadays. Kubernetes and Docker Swarm are two of the most powerful containerorchestration platforms.
Kubernetes and Spinnaker create a robust continuous delivery flow that helps to ensure your software is validated and shipped quickly.
This tutorial shows you how to create a continuous delivery pipeline using Docker Compose and Jenkins Pipeline. Kubernetes is too opinionated, hard to set up, quite different from Docker CLI. With Docker Compose you can run local development, deploy to dev/test and with very little change(removing any volume bindings, binding to different ports, setting environment variables differently) you can run on Docker Swarm cluster – so your local, dev, staging and production environment are almost identical. This tutorial is based on my previous POC: Event driven microservices architecture using Spring Cloud
So you are going to start 10 Spring Boot applications, 5 MongoDB instances, Jenkins, RabbitMQ, SonarQube, Zuul Gateway, Config Server, OAuth2 Server, Eureka Discovery and Hystrix Circuit Breaker. And the best of all, this complete continuous delivery pipeline(>20 containers) cost me only 100$ per month – ask me how.
Setting up Jenkins – see Jenkins online
sudo docker run -u root --rm -d -p 49001:8080 -p 50000:50000 -v jenkins-data:/var/jenkins_home -v /var/run/docker.sock:/var/run/docker.sock jenkinsci/blueocean
Add Jenkins Plugins: HTTP Request Plugin, JaCoCo plugin, Mask Passwords Plugin, Publish Over SSH, Sonar Quality Gates Plugin, SonarQube Scanner for Jenkins, SSH Agent Plugin, SSH plugin.
Setting up SonarQube – see SonarQube online
sudo docker run -d --name sonarqube -p 9091:9000 -p 9092:9092 sonarqube
Now, we are ready to build our CI/CD pipeline. You can manage the Jenkinsfile using git instead of using the Jenkins UI.
First, we need to setup the Docker credentials for GitHub, DockerHub and SSH to your server where you are planning to install your docker containers.
Writing Your Jenkins Job
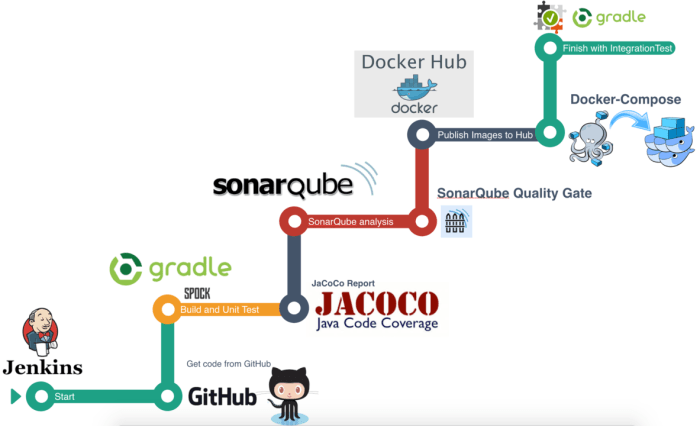
We will create nine stages: Preparation, Build & Unit Test, JaCoCo, SonarQube Analysis, SonarQube Quality Gate, Publish to DockerHub, Deploy, HealthCheck, Integration Test.

The Preparation stage will clone your code, the Build stage will build your code and run unit tests, the Publish stage will Push the Docker Image to your registry and the Deploy stage will deploy your containers. That’s how it will look like when you are done: Jenkins
Preparation Stage: Clone the project’s code.
stage('Get code from GitHub') {
      // Get code from a GitHub repository
      git 'https://github.com/sbruksha/Microservices-platform.git'
   }
Build and Unit Test Stage
stage('Build and Unit Test') {
      // Run build and test
      sh '''cd $WORKSPACE/account-service && ./gradlew clean build jacocoTestReport
    cd $WORKSPACE/appointment-service && ./gradlew clean build jacocoTestReport
    cd $WORKSPACE/auth-server && ./gradlew clean build jacocoTestReport
    ........
    '''
   }
Run JaCoCo Stage
stage('JaCoCo Report') {
      jacoco exclusionPattern: '**/test/**,**/lib/*', inclusionPattern: '**/*.class,**/*.java'
   }
After that step executes, you can see the reports here.
SonarQube Analysis Stage
stage('SonarQube analysis') {
        withSonarQubeEnv('Sonar') {
          sh '''cd $WORKSPACE/appointment-service && ./gradlew sonarqube \
 -Dsonar.host.url=http://dev.eodessa.com:9091 \
 -Dsonar.login=xxxxxxxxxxxxxxxxxxxxxxxxxxxx \
 -Dsonar.sources=src/main \
 -Dsonar.java.binaries=build/classes \
 -Dsonar.java.libraries=build/libs/*.jar
 ........'''
        }
   }
Quality cannot be injected after the fact, it must be part of the process from the very beginning. It is strongly recommended to inspect the code and make findings visible, as soon as possible. As part of the pipeline, the code is inspected, and only if the code is fine and meets the quality gates, the built artifacts are uploaded to the binary repository manager.
We can open the SonarQube web application and drill down to the finding, click hereor see the screenshot below:

As part of a Jenkins pipeline stage, SonarQube is configured to run and inspect the code. But this is just the first part, now we add the quality gate in order to break the build if code quality is not met.
SonarQube Quality Gate Stage
stage("SonarQube Quality Gate") {
        timeout(time: 1, unit: 'HOURS') {
           def qg = waitForQualityGate()
           if (qg.status != 'OK') {
             error "Pipeline aborted due to quality gate failure: ${qg.status}"
           }
        }
   }
Specifically the waitForQualityGate code will pause the pipeline until SonarQube analysis is completed and returns the quality gate status.
Publish Images to DockerHub Stage
stage('Publish Images to Hub') {
   		withCredentials([[$class: 'UsernamePasswordMultiBinding', credentialsId: '5e1c35ab-1404-4165-b224-8894cc70', usernameVariable: 'DOCKER_USER', passwordVariable: 'DOCKER_PASS'],]) {
        sh '''docker login -u ${DOCKER_USER} -p ${DOCKER_PASS}
    cd $WORKSPACE/account-service && ./gradlew build publishImage
    cd $WORKSPACE/appointment-service && ./gradlew build publishImage
    cd $WORKSPACE/auth-server && ./gradlew build publishImage
    ....................'''
    	}
   }
Make sure that the DOCKER_USER and DOCKER_PASS variables were created in the withCredentials section.
Deploy Images with Docker Compose Stage
stage('Deploy Images with Docker-Compose') {
        build 'EventDrivenPlatform-Dev-Deploy'
   }
Deploy stage will run “EvenDrivenPlatform-Dev-Deploy” job, which execute shell script on remote host using ssh: sudo docker-compose -f docker-compose.yml up -d
With Docker Compose you define a multi-container application in a single file, then spin your application up in a single command which does everything that needs to be done to get it running. You can create different Jenkins jobs for different environments: dev, stage, prod. The main function of Docker Compose is the creation of microservice architecture, containers and the links between them. After this stage is completed you can see:
- All your containers are running
- Eureka discovery server http://dev.eodessa.com:8761/
- Hystrix Dashboard, Zuul Gateway, RabbitMQ, ConfigServer, AuthServer, etc..
HealthCheck Stage
stage('HealthCheck') {
      httpRequest responseHandle: 'NONE', url: 'http://dev.eodessa.com/health'
   }
Integration Test Stage
stage('Integration Test') {
      sh '''cd $WORKSPACE/test-integration && ./gradlew clean test'''
   }
After creating the pipeline, you save our script and hit Build Now on the project home of our Jenkins dashboard.
Here’s an overview of the builds:

Each output is accessible when hovering over a stage cell and clicking the Logs button to see the log messages for that step.
You can also find more details of the code analysis, JaCoCo report and SonarQube. When you have successful build you can see the project running online.
All source code for this post is located in GitHub repository.
